Tradestation Indicators
Your Advantage to Beat the Market!
Advantage nBar High/Low Stop |
|||
 |
|||
nBar High/Low Stop is a simple, but time-proofed Stop Loss and Trailing Stop for trending markets. It generates a stop line based on the lows or highs from the last n bars. nBar High/Low Stop lets the profits grow during the trend and filters signals from other Tradestation indicators. Test our nBar High/Low Trailing Stop on the included strategy or use it in your own strategies with the enclosed function.
|
| ||
  |
|||
Advantage Trend Colors |
|||
 |
|||
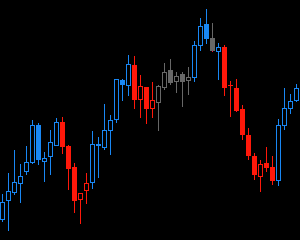
Is the trading signal strong or it is just another costly trap? Advantage Trend Colors identifies strong bars that can be used to confirm signals from other Tradestation indicators or classical technical analysis tools. It helps to enter the market at the first signs of a new trend and avoid false signals from weak bars that are often followed by a price reversal. Like Heikin-Ashi charts, it also colors the bars to indicate the dominant trend, but it does so in real-time, without any lag.
|
| ||
|
|||
Advantage Reversal Dots |
|||
 |
|||
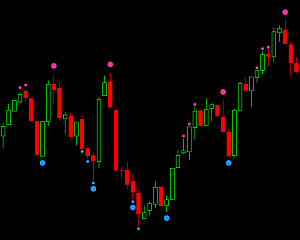
It is not recommended to catch a falling knife. But if you really want to do it, you'd better have the best tools available! Use Advantage Dots to identify strong overbought or oversold to catch bottoms and tops. You can use it for entering the trades in mean reversion markets or for taking profits in strong trends just before the corrections begin. Use these Tradestation indicators to trade precisely when the time is right.
|
| ||
|
|||
Advantage Trailing Lines |
|||
 |
|||
You trade following the trend… or against it. But first you must know what the current trend is and when it reverses. And the sooner you know it the better. This is what Advantage Lines are made for. We have tested, optimized and re-optimized hundreds of parameters for thousands of stocks and futures to find the best formula and choose right settings. Now you too can use them to find the best trend in trading.
|
| ||
|
|||
Advantage Trading Package |
|||
 |
|||
Advantage Trading Package - ultimate package of the best Tradestation indicators! We gathered our best indicators into one Package, that will help you build profitable strategies. Strategies tailored to your trading style and markets you trade on. Now you can follow the trend or trade against it. You can profit from long runs or catch bottoms and tops using our new Advantage Oscillator that is available exclusively from the Package. Check out for yourself how it is to precisely know when to open positions, when to close them and when to let your profits grow!
|
| ||
|
|||
Advantage RSI Ultimate |
|||
 |
|||
What is the most popular oscillator on charts around the globe? We bet it is Relative Strength Index (RSI). And since everybody knows what it is supposed to do – it does not do it. It just does “not work”. We disagree. RSI works – AFTER some adjustments are made. We take it, tweak it and get the most out of it! Check out Advantage RSI – an oscillator that gives traders a real edge.
|
| ||
|
|||
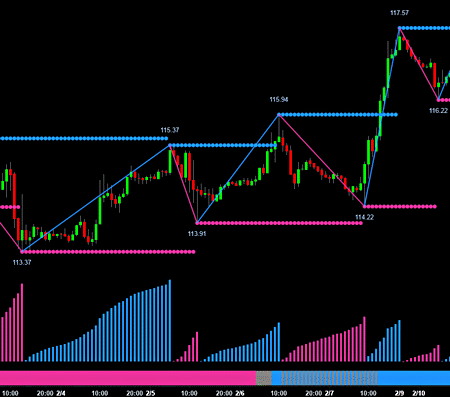
Advantage Volume Waves |
|||
 |
|||
Analyze market structure and chart patterns using price swings, find supports and resistances at the latest pivot points, and identify the accumulation and distribution areas to find trading opportunities. Advantage Volume Waves makes complex price and volume structures simple and easy to understand. This advanced indicator shows the dominant trend and helps to recognize turning points based on the volume flow, so you can trade in the direction of the main market movement and be prepared for its reversal.
|
| ||
|
|||