| |
|
|
|
|
|
|
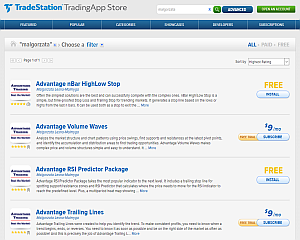
Check our reviews from official TradeStation Trading AppStore and see what we can offer you to help you trade profitably. Try out our most popular indicators and strategies used by traders worldwide. Take advantage of our Free Trial!
| |
|
|
|
|
| |
|
| |
|
|
|
|
|
|
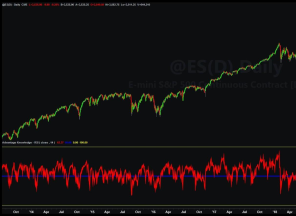
Follow Us on Twitter for more examples of our indicators and analysis of current market situation. Check how to use our indicators and strategies to take advantage over other traders and Beat the Market!
|
|
|
  |
|
| |
|
| |
|
|
|
|
|
|
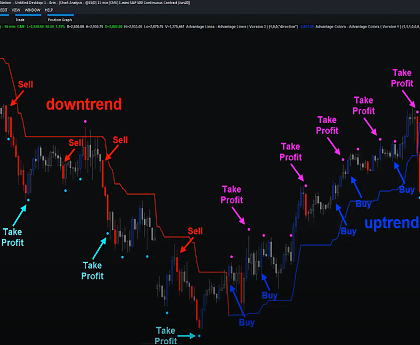
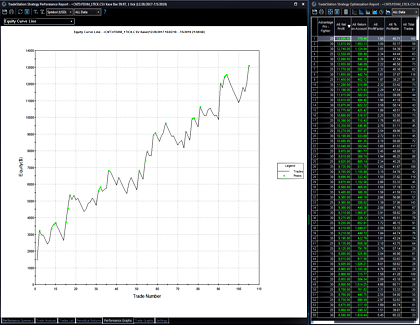
I thought it would be short answer to a simple question from one of our customers. But I was wrong… It is obvious to me how to combine all our indicators into a consistent and profitable strategy. But I’ve used most of them for years and just know how to interpret almost all the nuances of their behavior. I know what it means when the Advantage Oscillator makes double top on the chart or long red candlestick appears after the mid-term Dot. I know when to trade and when it’s better to hold back. And now I will try to show you all this. My way of trading.
|
|
|
|
|
| |
|
| |
|
|
|
|
|
|
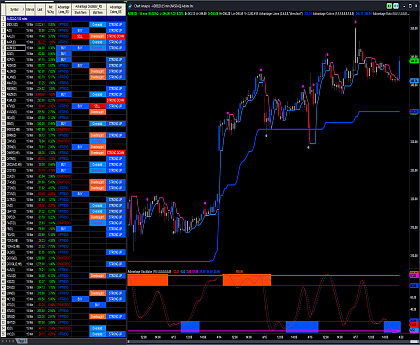
Advantage Package can be used to create various discretionary trading strategies. Use Advantage Lines to recognize and follow the trend, Advantage Colors to find strong signals and Dots or Oscillator for mean reversion signals. All you have to do is combine them into one logical and profitable strategy. Or lots of various strategies…
|
|
|
|
|
| |
|
| |
|
|
|
|
|
|
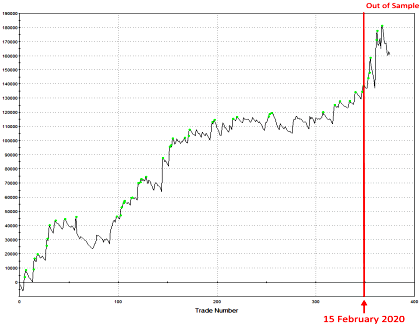
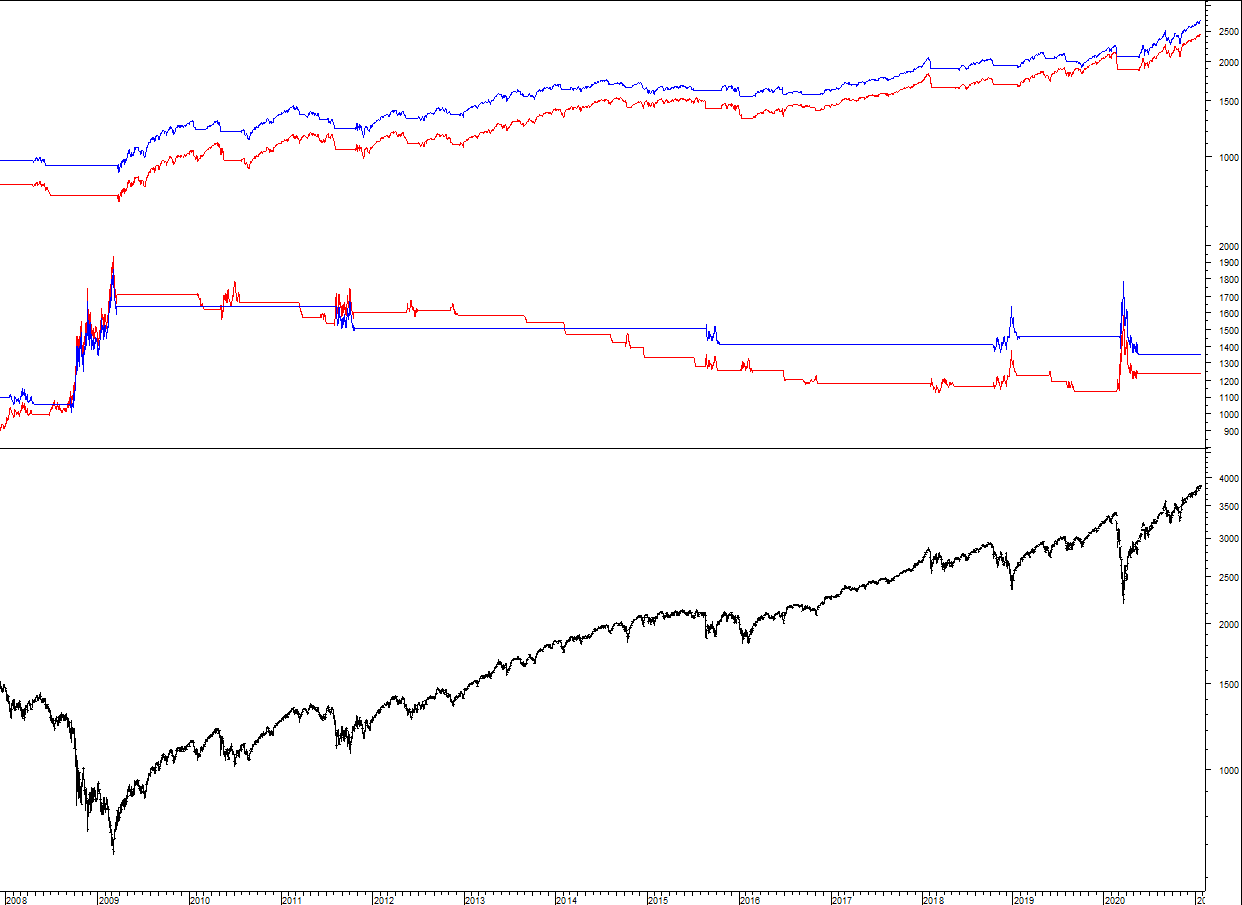
Check how the Coronavirus affected automated trading. Did the high volatility help or harm the performance of trading strategies? Or maybe it had no effect? We checked how the extraordinary volatility of recent weeks has impacted results of our strategies. Both trend following and one mean reversion strategy show that...
|
|
|
|
|
| |
|
| |
|
|
|
|
|
|
Time Bars or Range Bars? Which type of bars are better for trading? We tested our strategies for 18 months on minute and range bars. The results are clear and we know which bars should be used in automated trading to achieve better results. Higher profits, fewer trades and better risk metrics provide...
|
|
|
|
|
| |
|
| |
|
|
|
|
|
|
Using TradeStation platform, data and custom indicators we will look very closely at the most popular technical indicator – RSI. We will show what it really is, how to understand what we see on the charts and how to profit from it. Only new and fresh ideas.
|
|
|
|
|
| |
|
| |
|
|
|
|
|
|
Using the Relative Strength Index, we built a trailing stop that is used in a trading strategy. By definition, it works best in trending markets, but using the free optimization spreadsheet you can check it for yourself.
|
|
|
|
|
| |
|
| |
|
|
|
|
|
|
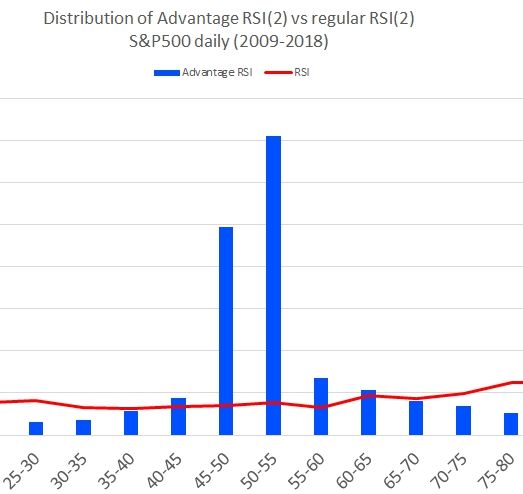
One of the most popular technical indicators comes in one setting: 14-period RSI... Ever wondered why? Why haven't I heard of 31-period RSI....? Or 3,47 or 88-period...? Probably because all settings below and above the initial value show confusing signals, that can't be compared against the same reference point: 30/70 zones. Well...not anymore...
|
|
|
|
|
| |
|
| |
|
|
|
|
|
|
RSI is a good technical indicator. When used properly it shows dominant market trend and also shows zones for potential local tops in uptrend (bottoms in downtrend) and zones to look for the ends of corrections.
Books say that when RSI(14) is crossing down 70 points line, trader gets a sell signal and when it is crossing up 30 points line a bottom was just formed. This is NOT how regular RSI should be used. In uptrend it will almost never get close to 30 and will frequently go above 70.
|
|
|
|
|
| |
|