RSI demystified: part 1 part 2 part 3
The idea to write an article on Relative Strength Index was born long ago. To show what it really is, what it isn’t and what are the strengths and weaknesses of using it. Most of the insights were meant to be described and shared. And they are. But to a surprise, some new and unexpected discoveries also occurred in the process. So instead of one article, I will be three of them… Or even more in the future. One thing is sure – what you are about to read was never published before, and I never even stumbled on any similar ideas. Hopefully, you will equally enjoy reading it as I enjoyed writing it.
Let me make one thing clear: I like working with RSI. RSI is not a bad indicator. Nor it is the best answer to trader’s problems.
It is just a product of mathematical operations derived from price data, that can be interpreted by a trader or used as a part of a trading strategy.
To start the dive into the RSI world, we have to go back to the basics. RSI is constrained between 0 and 100 points. Probably 99% of traders use 14-period setting and 99% of them look for reversals below 30 or above 70. Another thing are divergences between indicator and price behavior. But here, we will not discuss any of this, because it is a domain of discretionary,
not systematic trading.
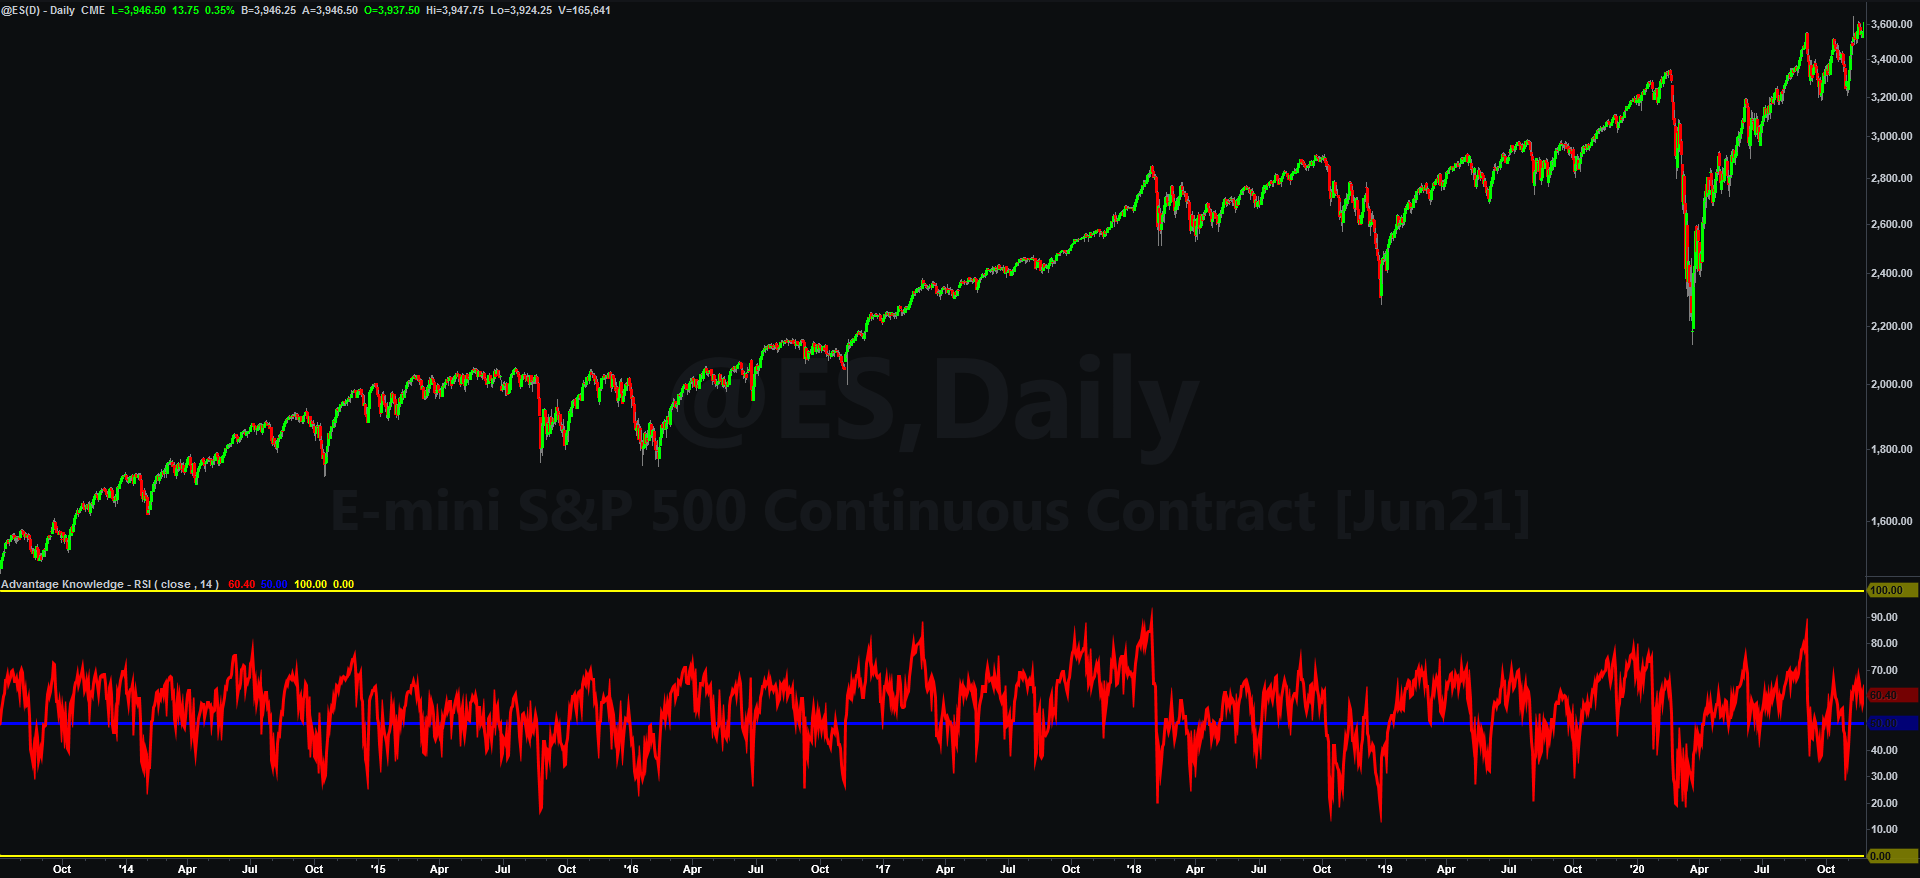
OK, if RSI is constrained in (0,100) zone it is not that hard to calculate, that the middle of this bracket is 50 point level. Sticking to RSI(14) we get:
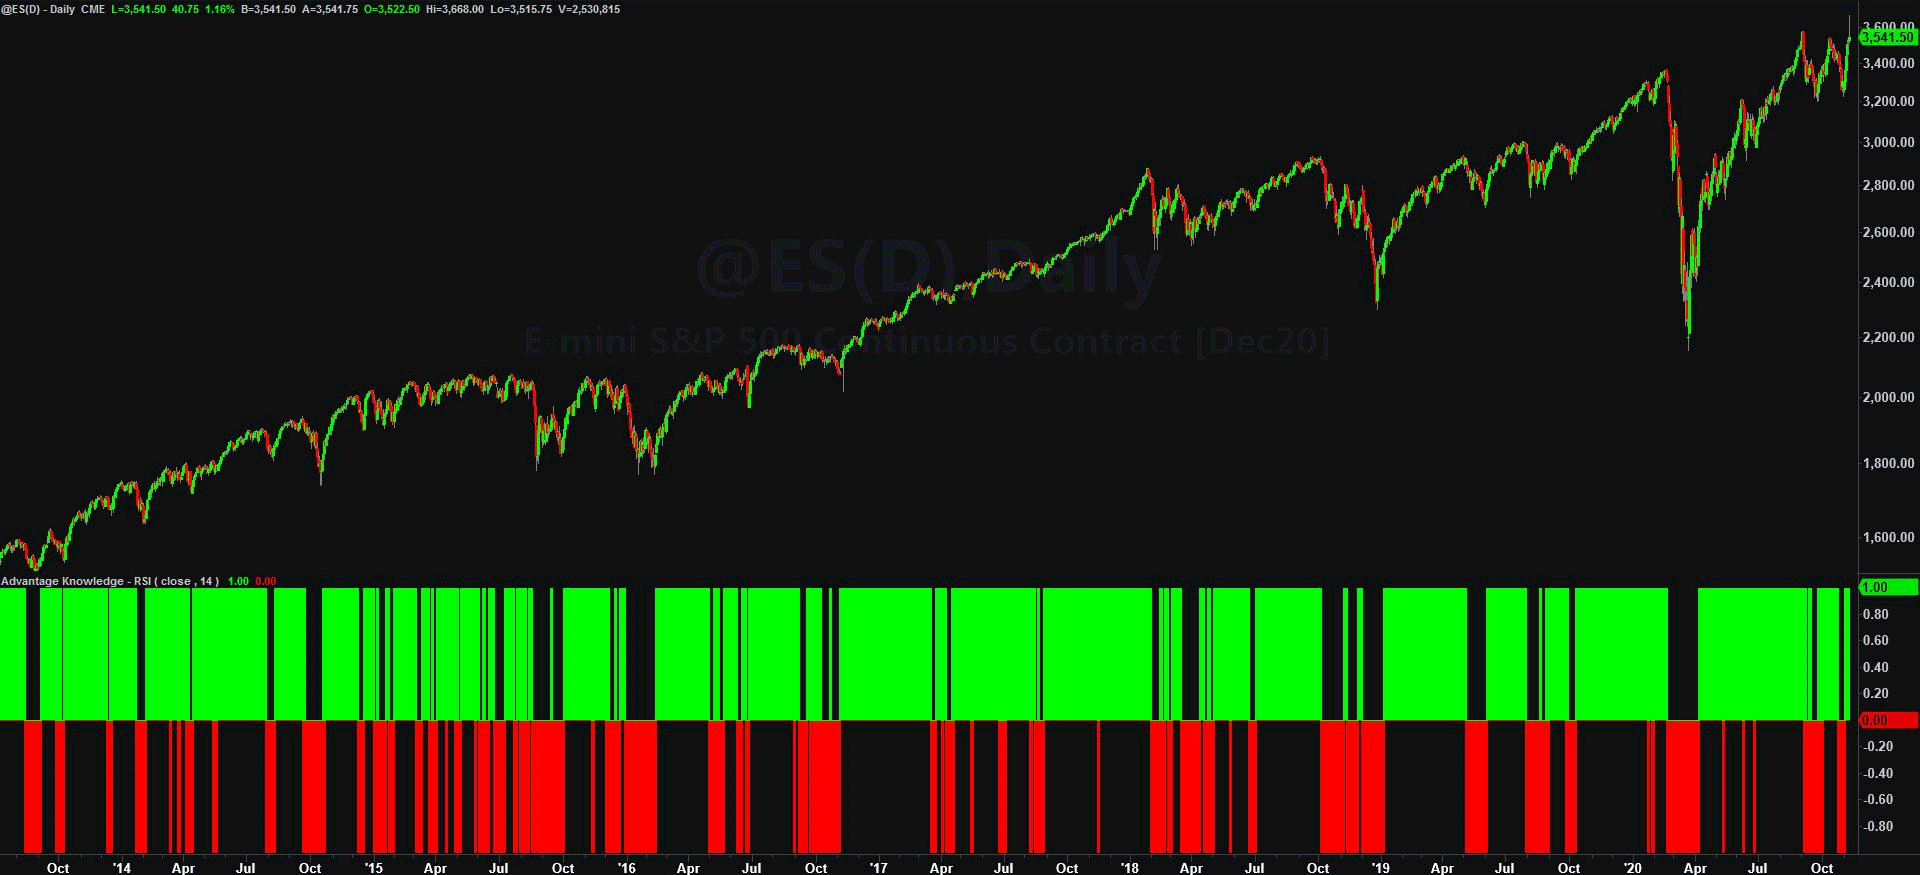
Sometimes RSI(14) is well above the 50 point level, sometimes it is well below it, and sometimes it crosses it frequently. If we create a simple strategy that holds long position (1) when RSI(14) > 50 and short position (-1) when RSI(14) < 50 than we will get:
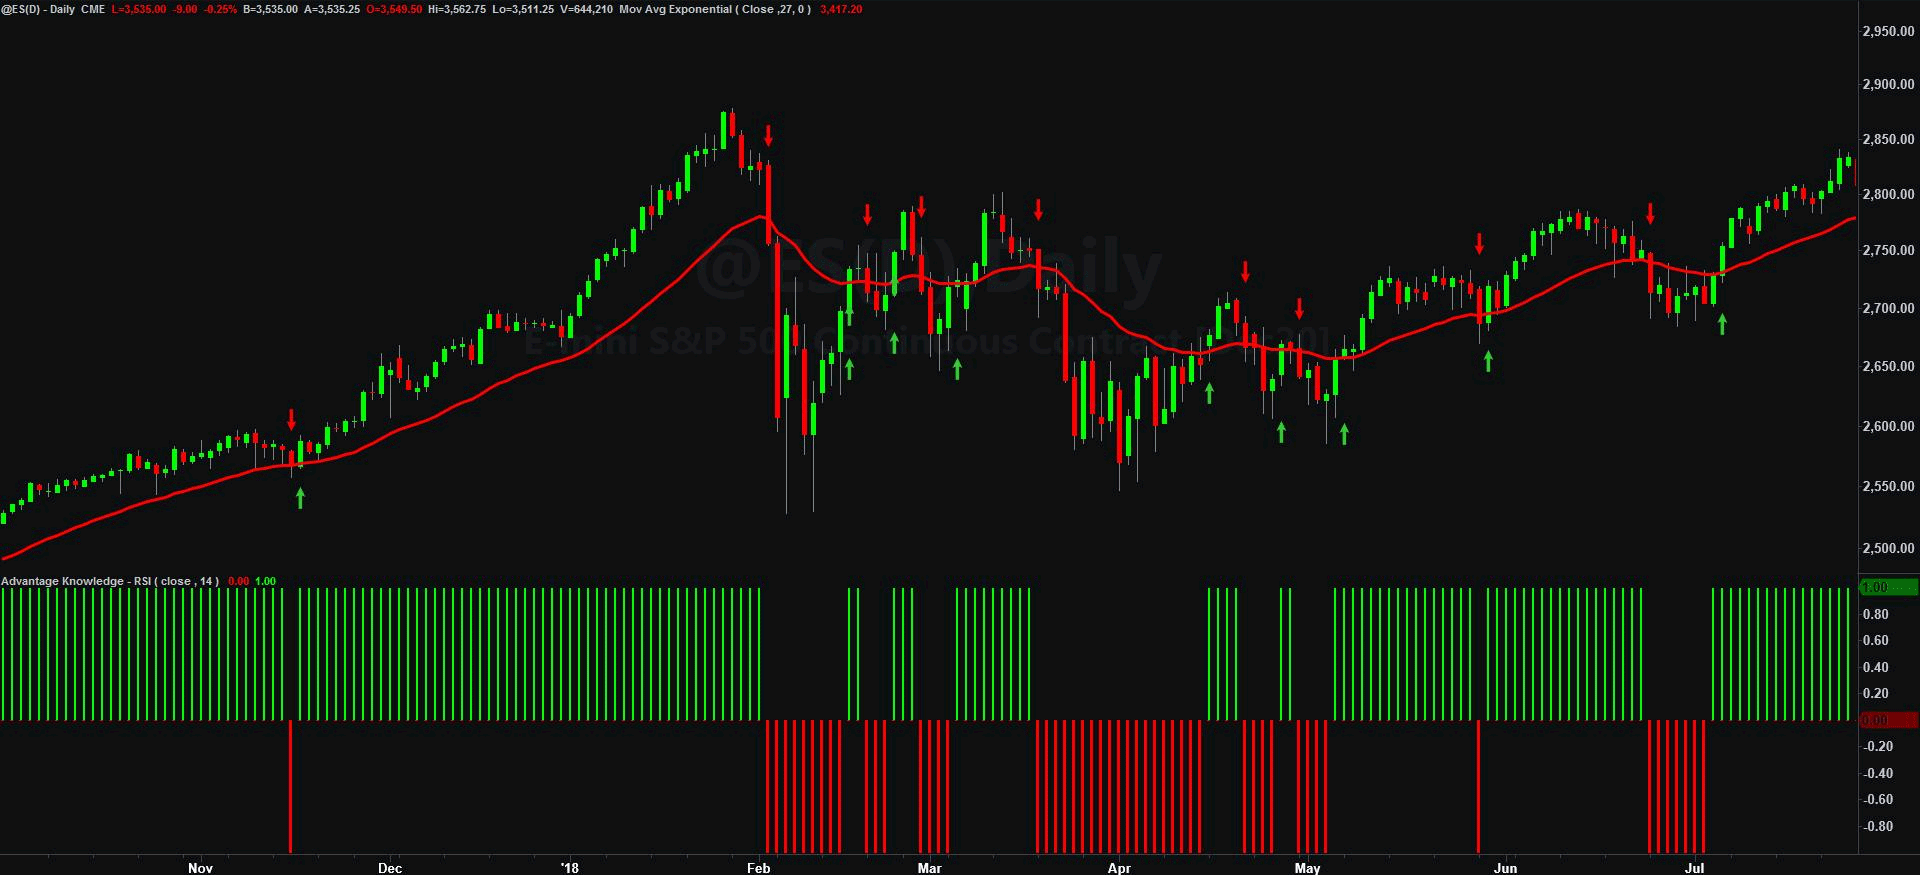
Now, it gets interesting... Zooming in the period of choppy market when RSI(14) crossed the 50 point line frequently, and comparing it with how price behaved in relation to 27-period exponential moving average (RSI is calculated using Wilder Moving Average (more here), so the TRUE period for exponential moving average smoothing is 2*14 – 1 = 27 bars), we can see that the RSI above/below 50-points signals take place at the same time as the crossovers of price and exponential moving average.
Is this coincidence? How close is the 50-point line to the exponential moving average of the corresponding period length? Can we calculate the difference? Can we calculate the 50-point level in terms of price value… ?
To get the answers we have to get a little crafty. RSI indicator can be reversed, so we can create RSI Predictor. The idea is quite simple:
Dear RSI Predictor,
Please tell me, (at the end of the bar) what price has to be reached (next bar close) for my RSI indicator to read (next bar close) the desired number.
Truly yours,
Trader Joe
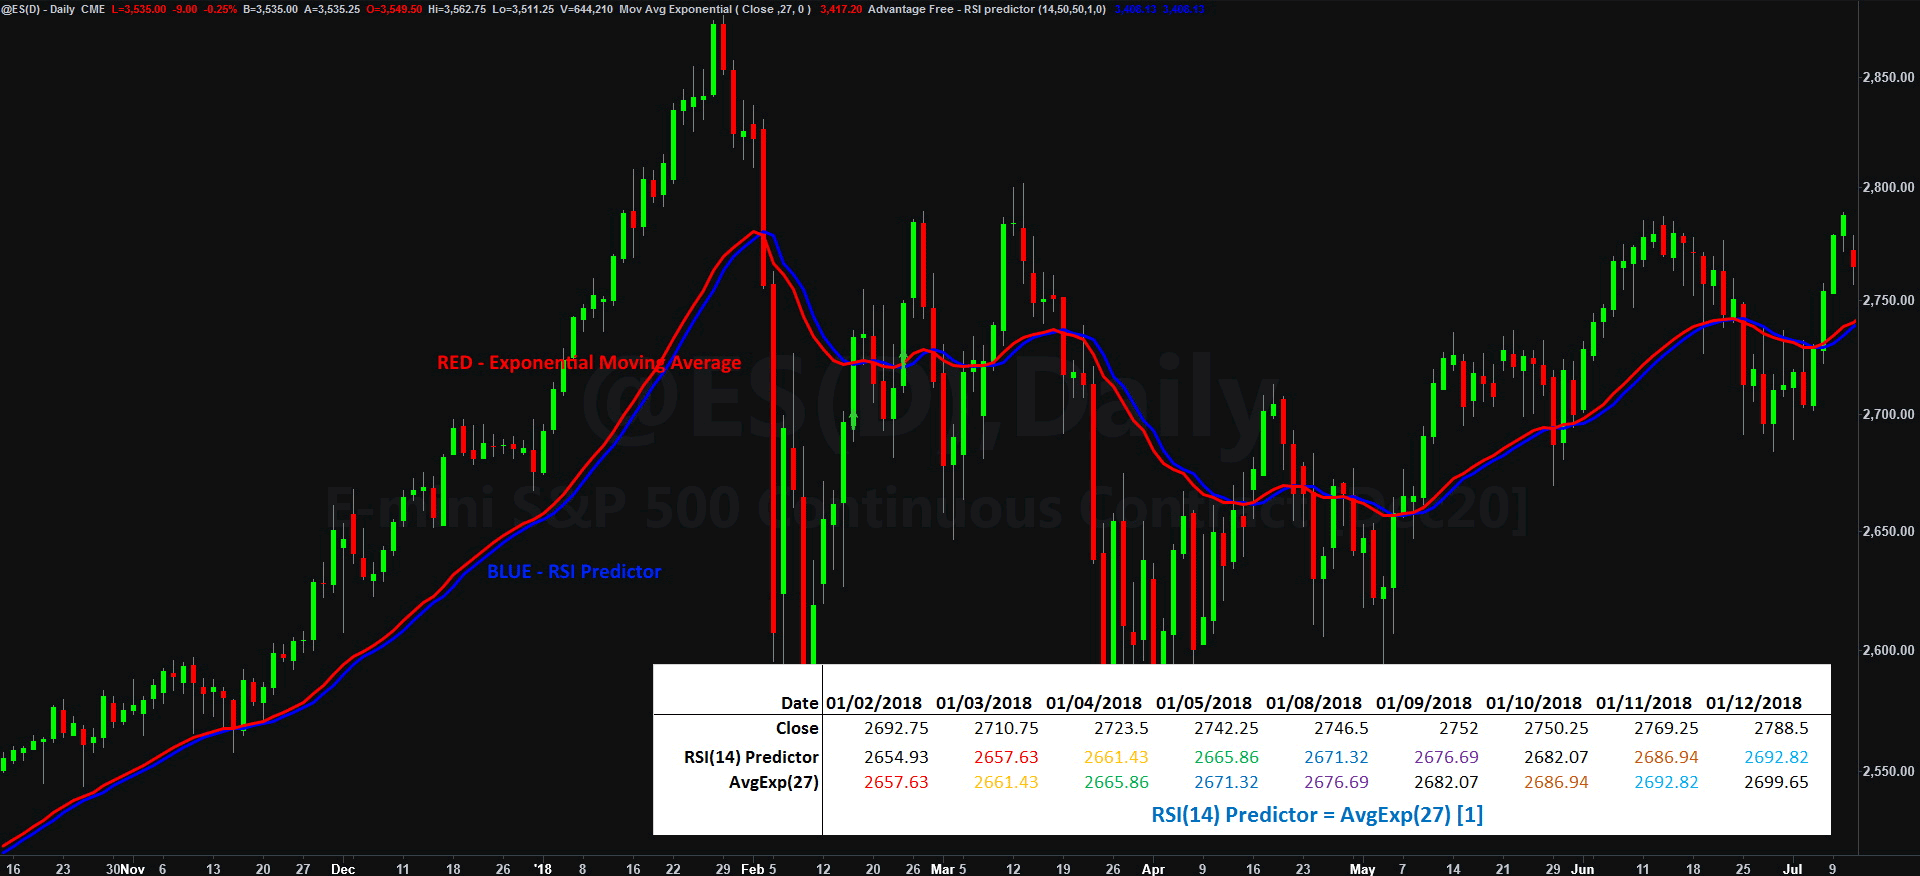
Using RSI Predictor to calculate the desired price for RSI(14) to read 50 points, and comparing it to the exponential moving average (27) we notice something very interesting:
Wow! They both look the same... The only difference is the 1-bar offset between RSI Predictor and Exponential Moving Average, which means that RSI 50-point level IS the exponential moving average! So, any other number that RSI shows has to be interpreted as a distance from it.
Making long story short: if RSI(14) is above 50-points than price (close) is above ExpMA(27), and if RSI(14) is below 50-points than price (close) is below ExpMA(27). It is not a magnificent discovery, but without it, we will not be able to properly understand the information we get from our charts, and will fall prey to charlatans telling the fairy tells about magical properties that Relative Strength Index supposedly has.
In the next articles we will check why 14-period setting is the most popular, will compare RSI with histogram of distance from ExpMA, will investigate why short period RSIs reach 5/95 zones really quickly, and why long period RSIs never get there, plus we also will come up with a solution to all the problems that will be diagnosed along the way.
RSI demystified: part 1 part 2 part 3