RSI indicator finally explained
truth, the whole truth and nothing but the truth
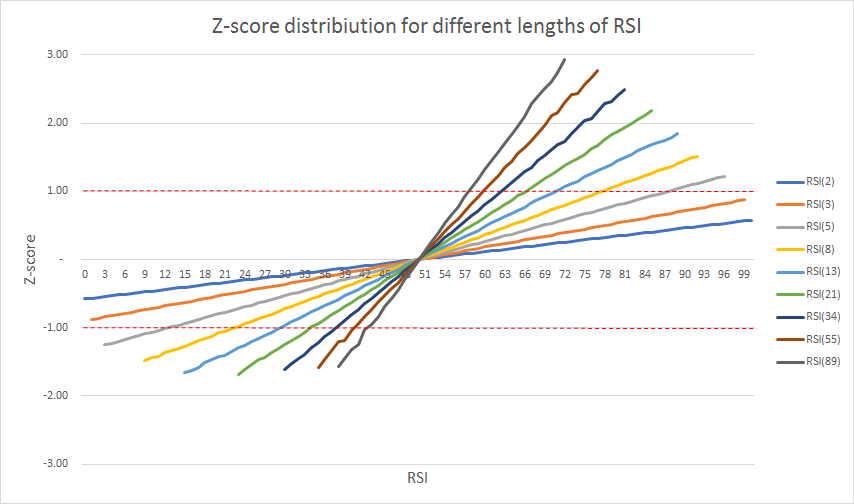
RSI demystified: part 1 part 2 part 3 In the previous articles we investigated the properties of Relative Strength Index. What we know so far, is that when RSI crosses the 50-point line it means that price crosses the exponential moving average of corresponding length (2*period-1). We also discovered that overbought (70-points) and oversold (30-points) levels are associated to volatility band that can be drawn around moving average. 70-point line for RSI(14) equals upper (+1) volatility band from moving average, and 30-point line equals lower (-1) volatility band from moving average. Right now, it’s time to check the behavior of other period lengths used for RSI calculation. We will still use the same logic for constructing volatility band, so it is recommended to read previous articles before continuing. There is one thing that is consistent with previous discoveries: No matter the period length for RSI, the 50-point line is still an exponential moving average of the corresponding length. But when we compare how zscore translates into levels that RSI indicator reaches, then we see, that the +1 and -1 zscore is never reached by RSI(2) and RSI(3), and is really quickly reached by RSI(55) or RSI(89). So even when RSI(2) drops to 1 point or go as high as 99 points the zscore is still way above -1 or below 1. On the other hand, RSI(89) moving to 58-points already translated into +1 zscore and dropping to 42-points translates to -1 zscore. This means that any attempt to average or compare RSIs of different lengths in order to get the full picture of market situation is a wasted effort. But this in not the only problem we have with the behavior of RSI of different lengths. Even from the above chart we see that RSI(2) can take pretty much any number between 0 and 100, and RSI(89) will barely reach 70-points and in the last 10 years (S&P500 futures) did not drop below 37-points. The asymmetry in positive and negative extremes are caused by the current bull market, so the next pictures will be built using almost 20 years of data for S&P500 index.
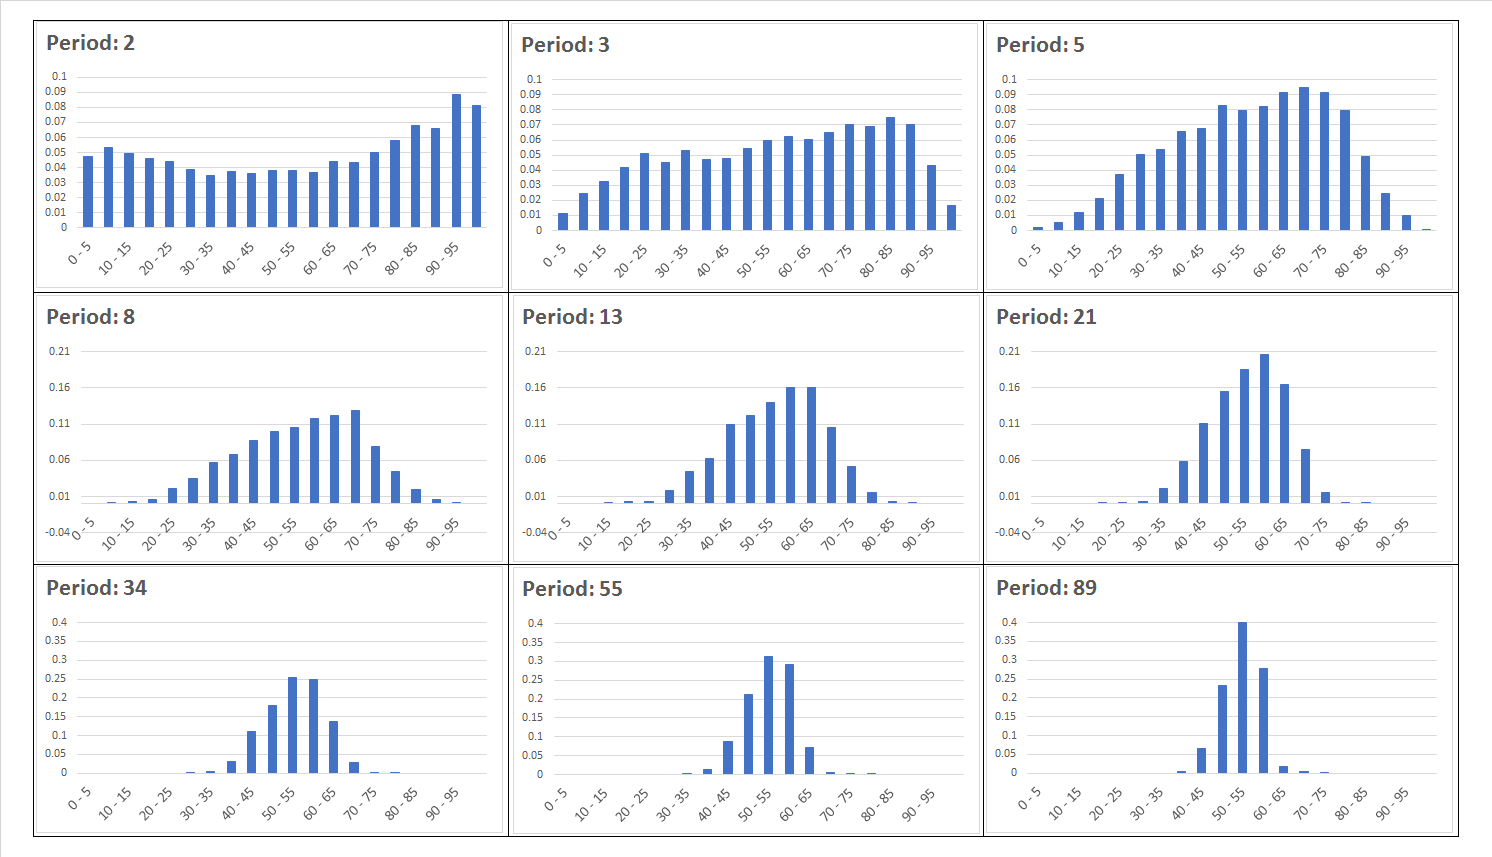
The above picture shows the distributions of RSI readings depending on the period length. Starting from the shortest period we get a bimodal distribiution (RSI(2) will most of the time be in a 5-10 or 90-95 point bin) that through almost uniform distribiution of RSI(3) transforms into platykurtic distribiution (RSI(5) and RSI(8)). After that we finally go to something that we know and are used to: normal distribiution aka “the bell curve”. This happens when RSI length is set to 13 or 21. Once we move into “long term territory” (34,55,89) the density function gets more and more leptokurtic.
So, this is another view of the same problem with RSI. The trader, without dropping its habits, just can’t get a good deal of valuable information from short or long term period RSIs, because only mid-term lengths (the one and only RSI(14)) show the picture of the market through the lens that we are used to: the bell curve.
The mistakes that come from using the normal distribution with financial data is a longer and more complex story, so for now let’s just stick to the main subject – RSI indicator.
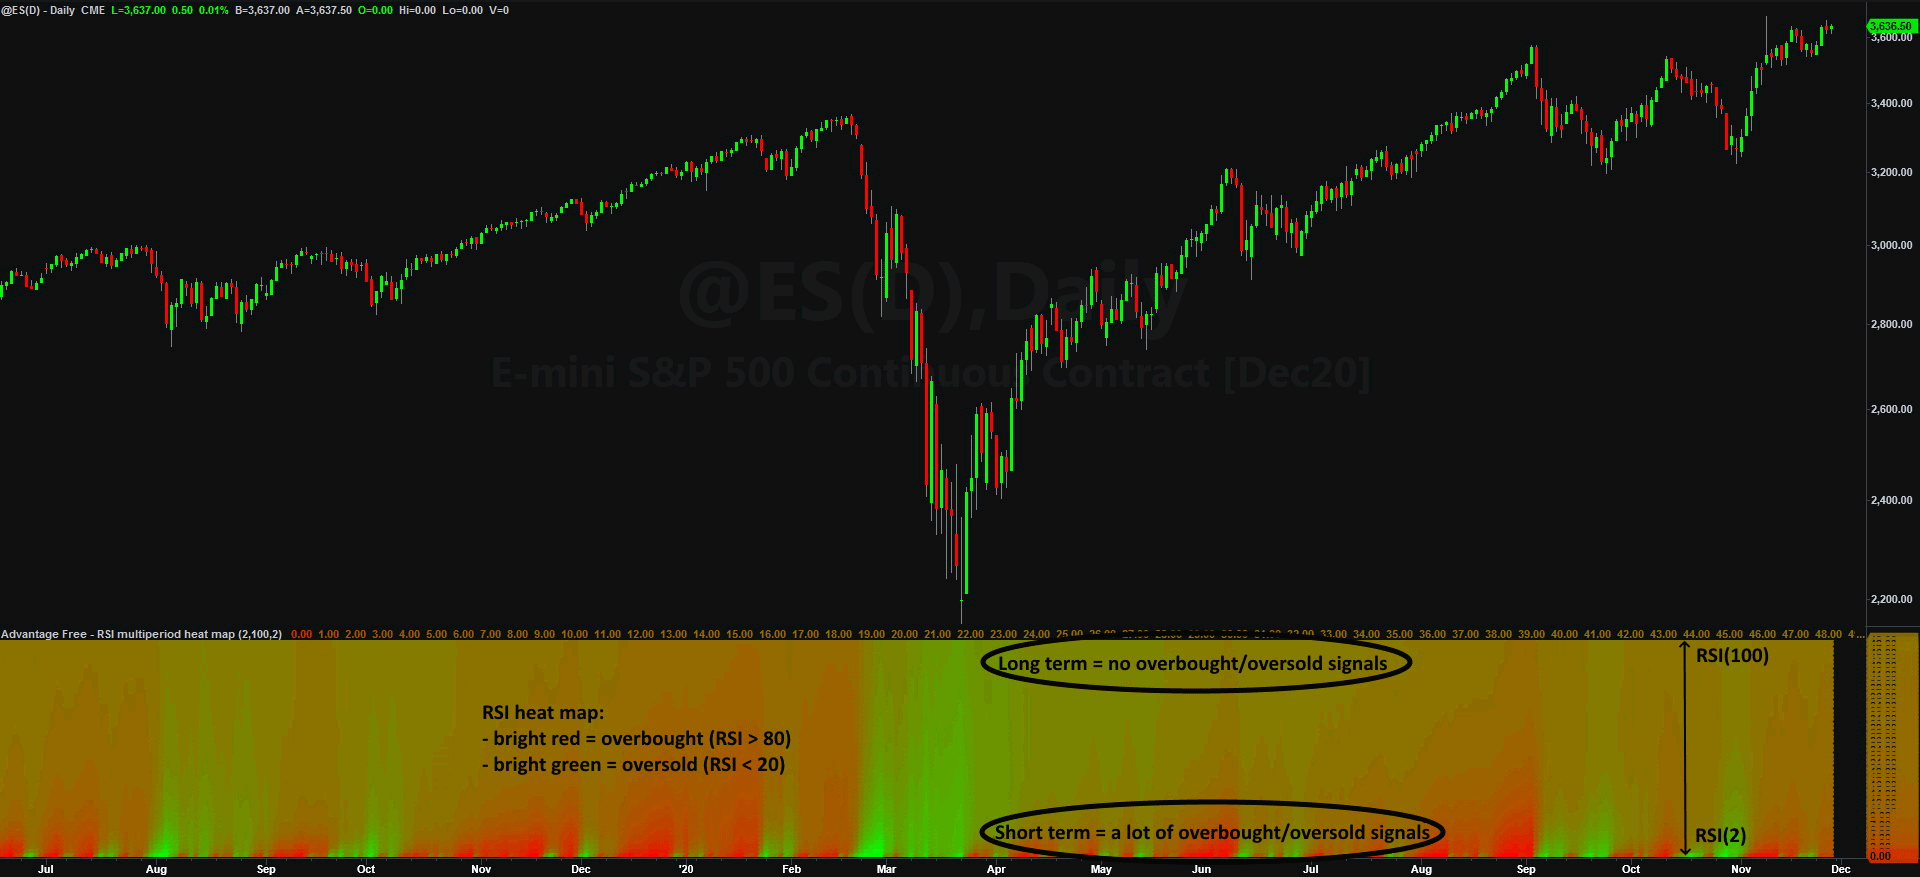
We just discussed that RSI indicator is badly calibrated. It shows one kind of properties for short term settings, other properties for medium term settings and totally different properties for long term settings. The best visualization we get by looking at the heat map, where we plot 50 different RSI lengths at once. The idea is simple – put more and more red when RSI is high (>80), put more and more green when RSI is low(<20).
The first row from the bottom is RSI(2) and the top one is RSI(100). The information we get from this chart is not a surprise. The bottom rows change colors from bright red (overbought) to bright green (oversold) really frequently, which is consistent with the previous chart, where RSI(2) has a bimodal distribution. And the top rows, where long period RSIs are plotted, barely get affected by price movements. The only things that change are the pale shades of red or green. And of course, this is also expected, because long term RSIs rarely brake from 40- to 60-point range. |