Why 30- and 70-point levels are important for RSI(14)?
truth, the whole truth and nothing but the truth
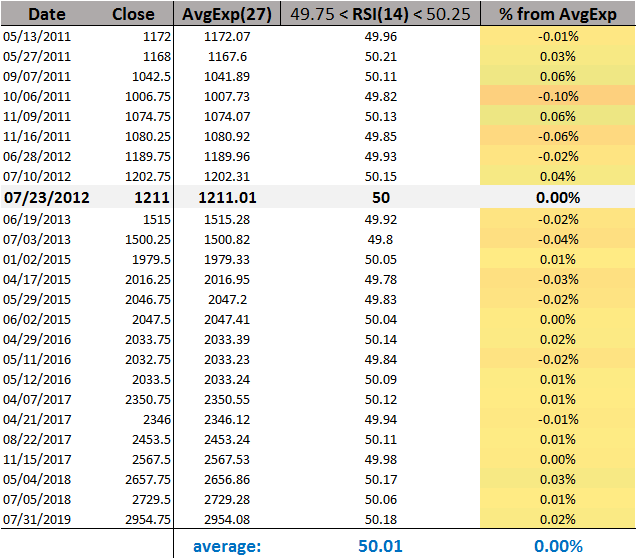
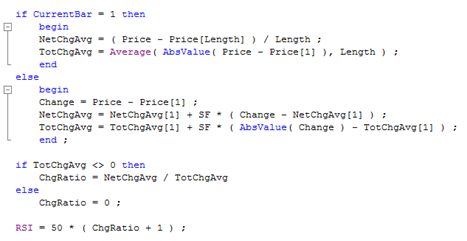
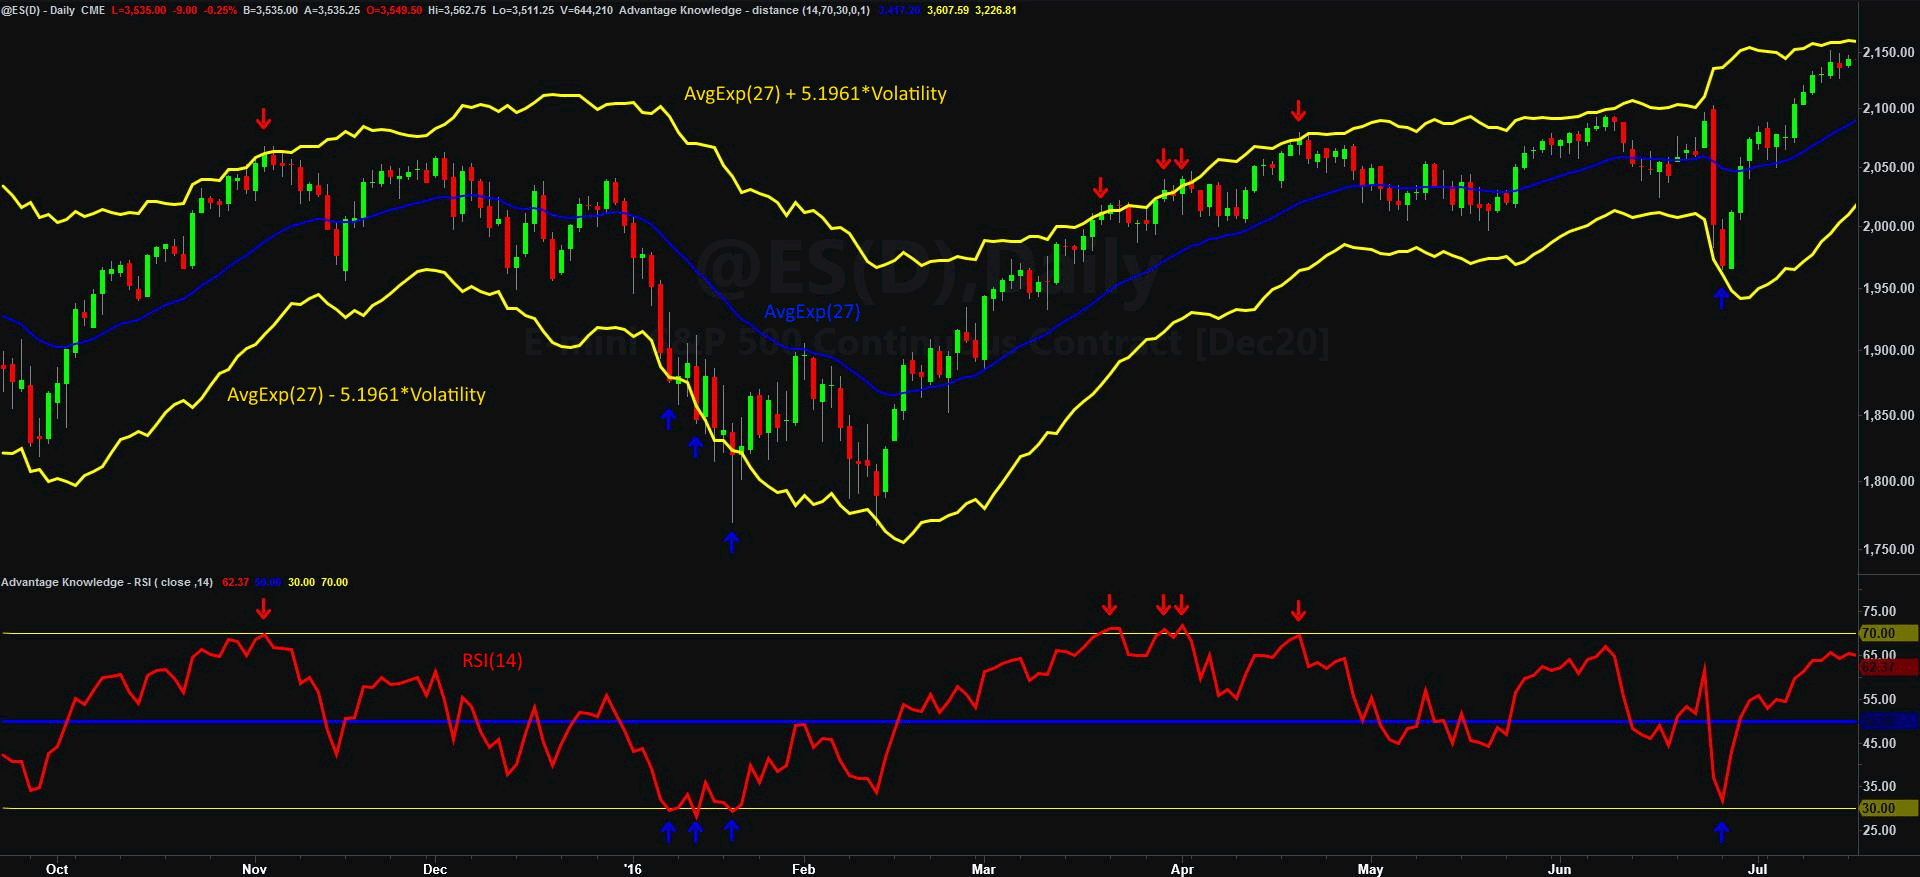
RSI demystified: part 1 part 2 part 3 In the previous article we found out (mathematically) that when RSI crosses the 50-point line it means that the price crosses the exponential moving average of corresponding length (2*period-1). Right now, it’s time to empirically check if it is really true… Translating it to price (close) distance from 27-period exponential moving average (in percent) we see that our calculations were right, and RSI 50-point line is indeed an exponential moving average (0.01-point difference is negligible). To fully understand what RSI is really showing we have to go back to the calculation behind one of the most popular indicators in the history of chart analysis. Without going into much detail, we can say that RSI is calculated as a (exponentially smoothed) ratio of how much price moved in one direction to how much price moved (in absolute terms) at all. In TradeStations’ EasyLanguage: The key component that we will work with will be “TotChgAvg” which is the Exponential Moving Average of the absolute price movement (always positive numbers). The mentioned price movement is simply the difference between today’s and yesterday’s close, which is the most basic volatility measure. Note that, it’s not Average True Range because it only takes closes and disregards the high and low, but in our case, it will be the volatility estimator that we will work with. With regard to volatility estimators, there is many more of them, but most of them share one thing in common – a scaling factor. For RSI(14) it will be 5.1961 which is the square root of 27 (moving average length). Therefore, we can draw a band around 27-period exponential moving average: upper boundary will be AvgExp(27) + 5,1961*TotChgAvg and lower boundary AvgExp(27) - 5,1961*TotChgAvg.
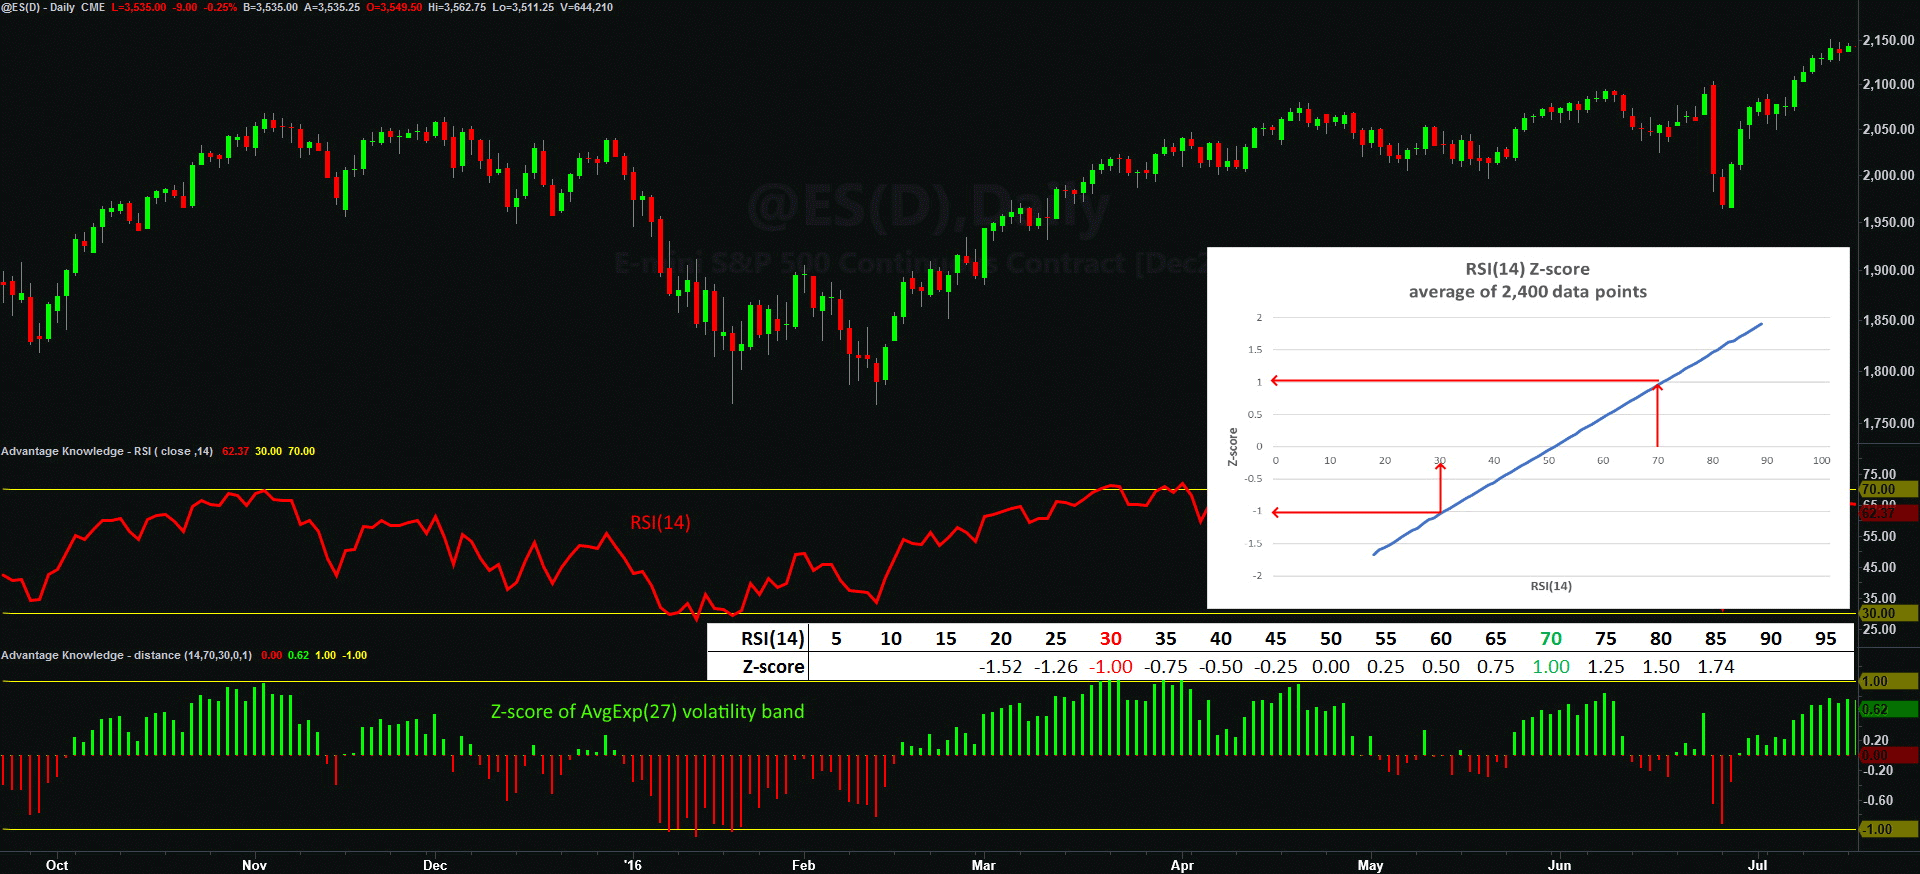
This particular volatility band does not differentiate much from others of this kind like Bollinger Band or Keltner Band. The one thing that stands out are the red/blue arrows showing moments when RSI was close to 70 points (red arrow) or 30 points (blue arrow). At the same time, price was really close to the upper or lower boundary of our volatility channel. To check how close we will translate the volatility band into a standard score histogram: Now, we’re onto something… I don’t know if this was the intention of the RSI creator to highlight 30/70 points levels because it is a +1 and -1 (scaled) volatility zone, but that what it really is. When RSI(14) is 70 then price is (almost) exactly at upper volatility band, and when RSI(14) is 30 then price is (almost) exactly at lower volatility band. So, we just made more progress on learning about real RSI properties. We now know that RSI (at least RSI(14)) is a standardized score of a price in relation to exponential moving average, and know why 30 and 70-point lines are so important. This, per se, does not invalidate all the tips and tricks about using RSI, but sheds new light on this well-known indicator. And sadly shows, that a huge number of traders use RSI without really understanding its real properties. In the next article we will investigate if the properties that we just discovered apply to period lengths other than 14. RSI demystified: part 1 part 2 part 3 |